View website access log or Apache log
Both Plesk and cPanel provide easy access to website logs, which are crucial for diagnosing server issues. These logs can help you identify the root cause of problems, such as why a website went down or experienced issues. Access logs are particularly useful, and there are different types to monitor:
The Apache error_log: This log contains diagnostic information and records any errors Apache encounters while processing requests.
Apache logs in Plesk
For a full list of the different log types available please visit Plesk’s information page.
1. Log into your Plesk control panel, you can do this directly via the URL or from your client area.
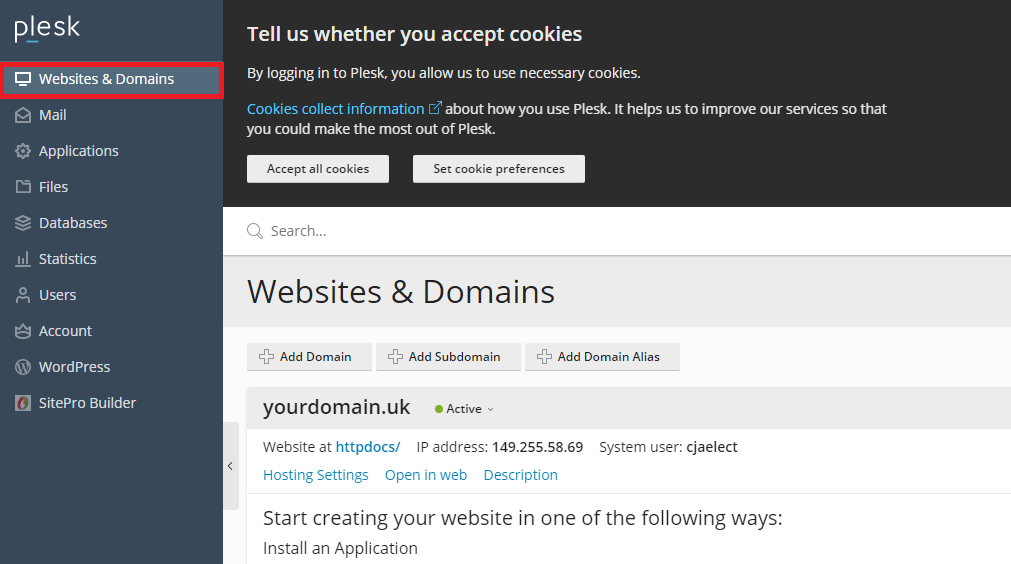
2. From your control panel, click Websites & Domains.
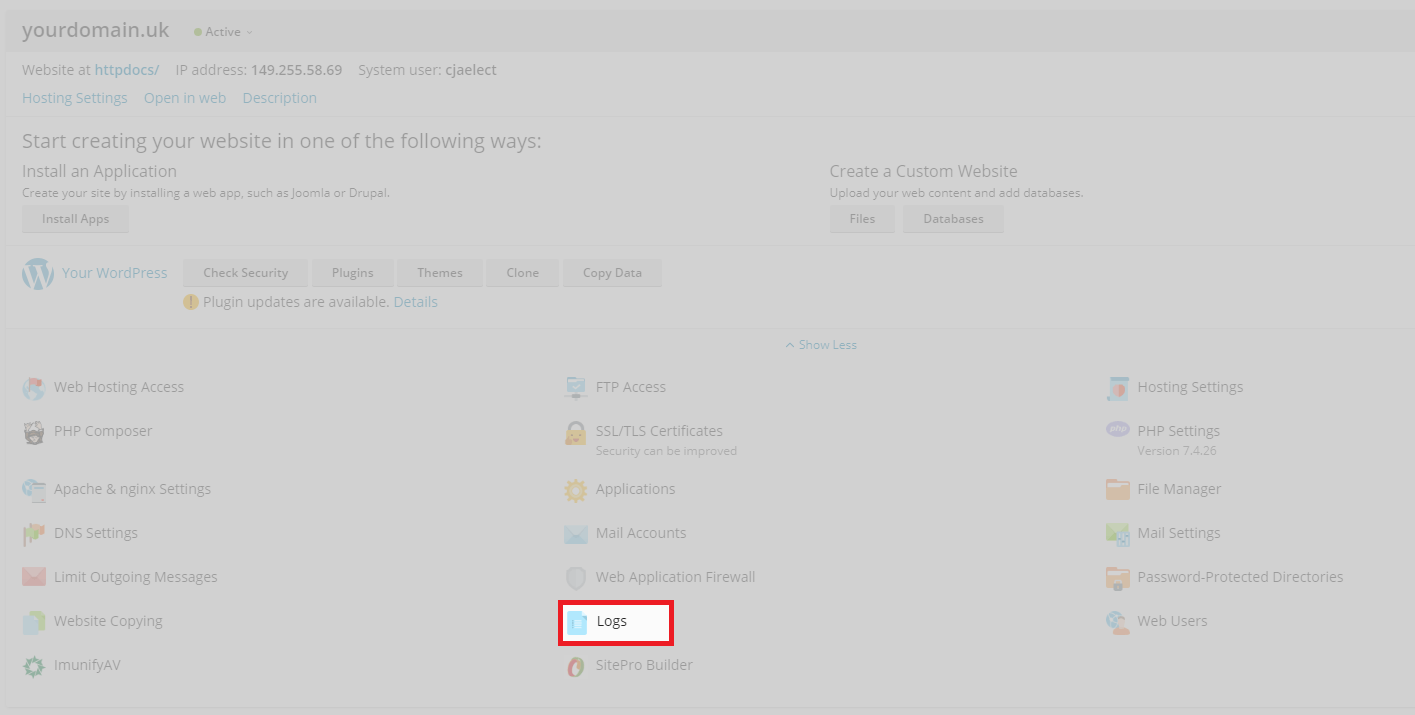
3. Each domain within your Plesk subscription should be separated, each with its own Logs icon. For your intended domain, click the logs icon.
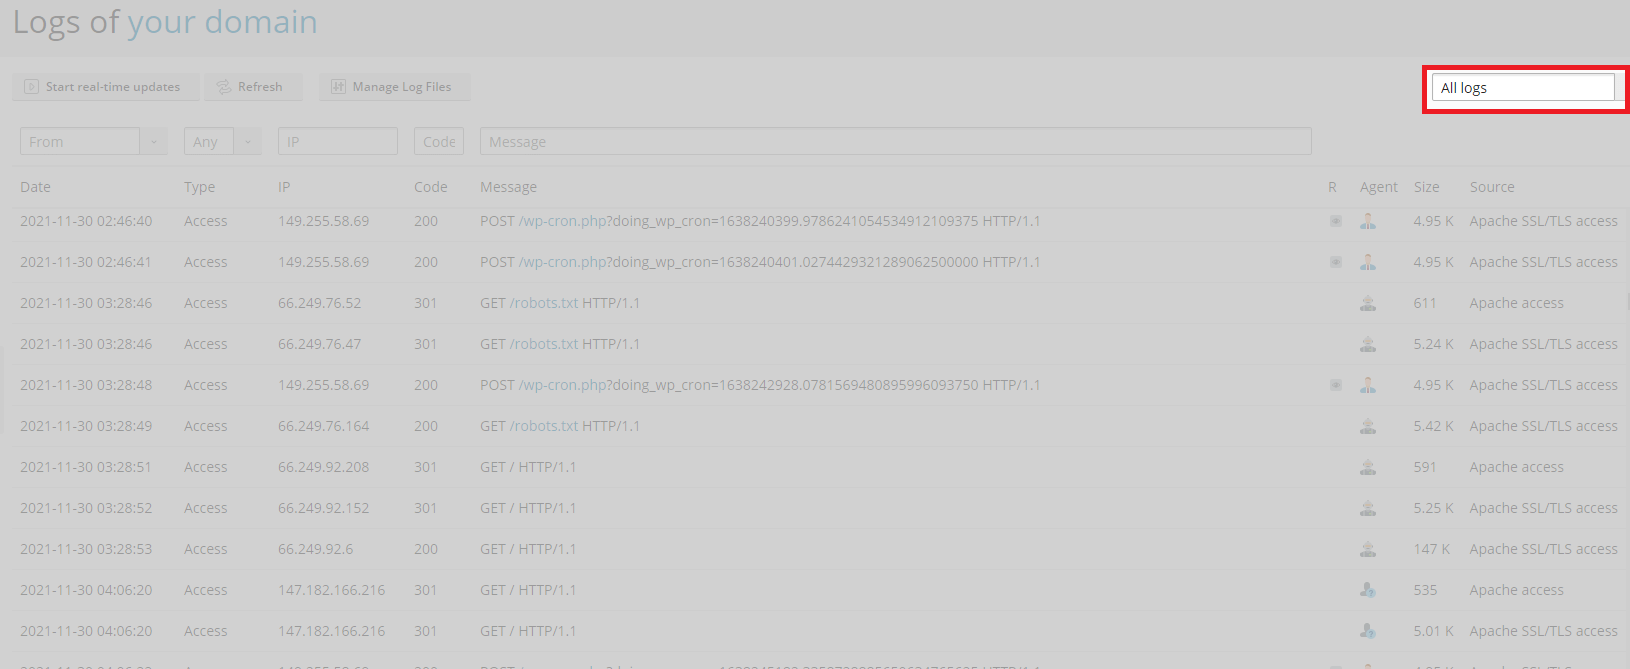
4. This will show all the log entries selected logs.
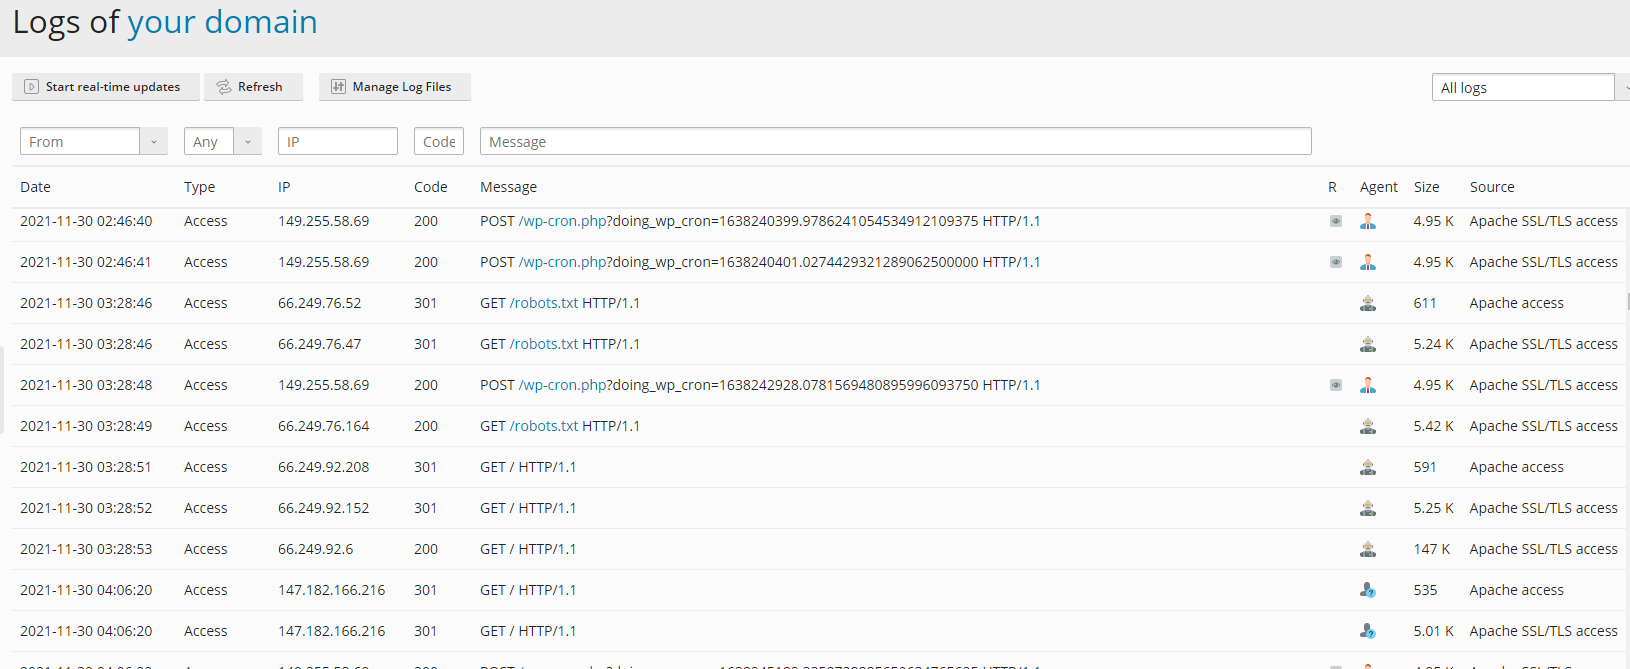
5. You can manage the shown logs via the drop-down menu. However, in most cases this won’t be required.
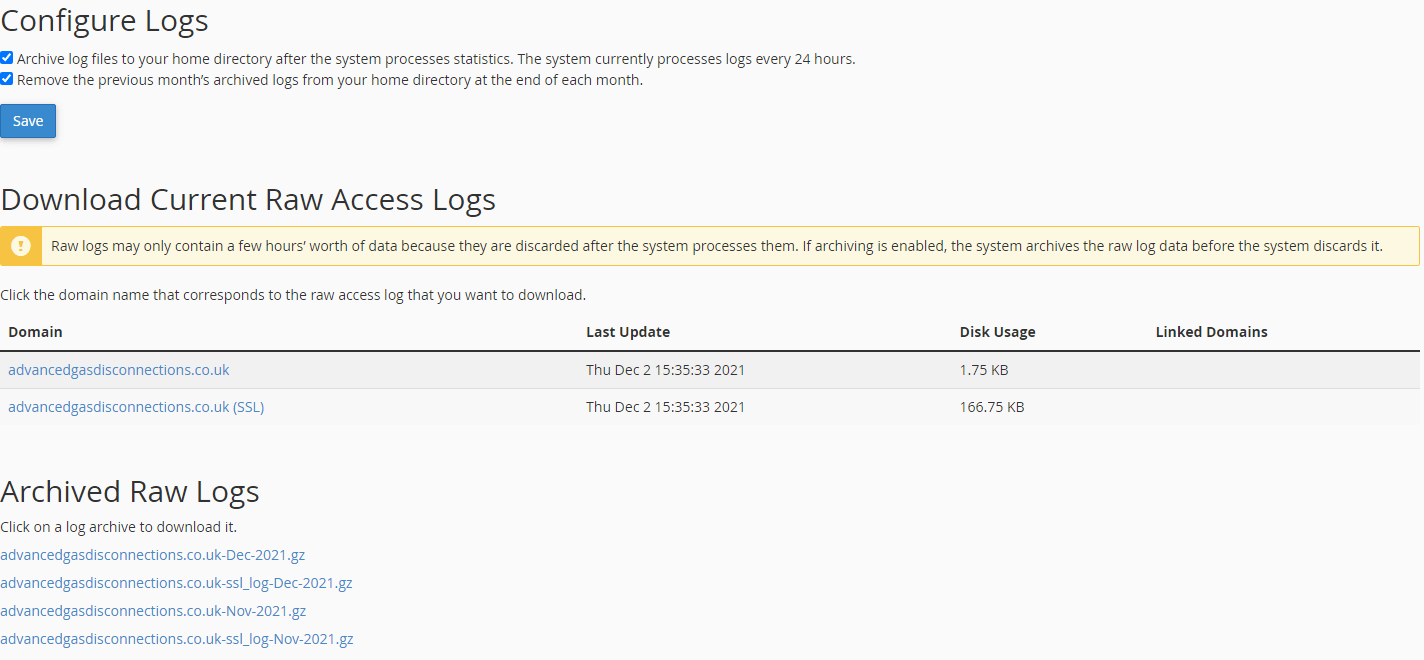
Raw Access Logs in cPanel
cPanel offers logs through the Raw Access tool in the metrics section. Logs are displayed in a table and reference every domain on that cPanel account.
With both SSL and non-SSL versions shown. There are also, archived versions of these logs available you can see these in monthly increments, contained within tar.gz files.
1. Firstly, log in to your cPanel control panel and navigate to the metrics section.
2. Once you are in the Metrics area, click Raw Access.

3. From here you can configure logs. And, view both current and archived logs